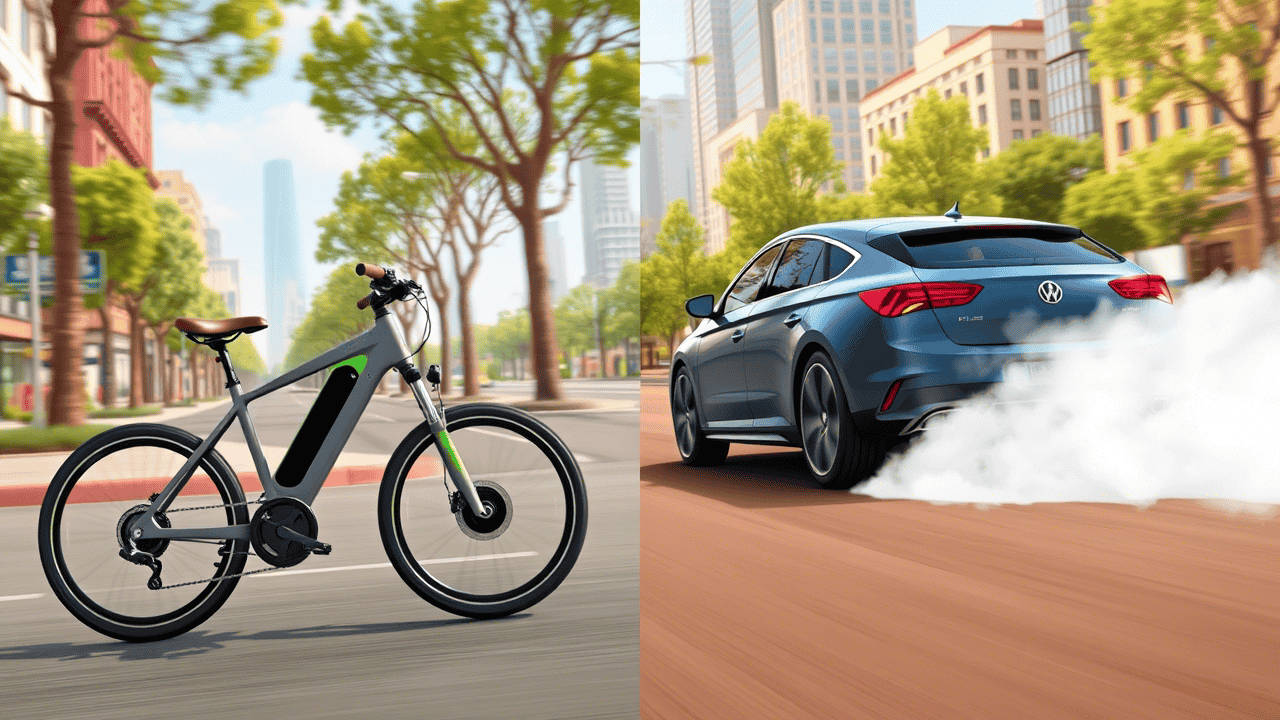
Comparing Ebikes and Cars for Sustainable Transportation

As cities aim to reduce emissions and congestion, electric bikes are emerging as a sustainable alternative to cars. This in-depth comparison explores ebikes and cars across key sustainability metrics including cost, environmental impact, health benefits, and urban mobility.
Understanding Ebikes and Cars
Ebikes are bicycles equipped with electric motors that assist pedaling, offering:
- Class 1: Pedal-assist only, up to 20 mph
- Class 2: Pedal-assist + throttle, up to 20 mph
- Class 3: Pedal-assist only, up to 28 mph
Cars (ICE and EV) offer longer range and higher cargo capacity but contribute more to emissions and congestion.
Environmental Impact
| Aspect | Ebikes | Cars (Petrol/EV) |
|---|---|---|
| CO₂ Emissions (Lifecycle) | 0.3 tons (54% from use) | Petrol: 55.6 tons; EV: 29.1 tons |
| CO₂ per km | 9g | 271g (Petrol) |
| Annual Reduction | 225 kg per rider | N/A |
| Energy Use | Minimal (equivalent to light bulbs) | High (fuel or charging) |
Cost Analysis
Ebikes are far more affordable than cars, both upfront and over time.
| Cost Factor | Ebikes | Cars (Petrol/EV) |
|---|---|---|
| Purchase Price | $1,000–$4,000 | $30,000–$50,000 |
| Charging/Fuel Cost (Annually) | $21 | $2,635 (Gas); $500–$1,200 (EV) |
| Maintenance | $100–$300/year | $700–$1,000/year |
| Insurance | ~$50/year (if needed) | $1,000–$1,500/year |
| Total Savings | $2,000–$3,000/year | N/A |
Convenience and Practicality
| Aspect | Ebikes | Cars |
|---|---|---|
| Range | 20–100 miles | 200+ miles |
| Speed | Up to 28 mph | 70+ mph |
| Carrying Capacity | Limited (cargo models improving) | High (families, large cargo) |
| Weather/Terrain | Moderate (improving with design) | Highly versatile |
Health and Social Benefits
Ebikes promote physical activity, encouraging riders to travel farther and more frequently than traditional cyclists. Research shows they improve cardiovascular health and reduce chronic disease risks.
Cars, on the other hand, contribute to sedentary lifestyles and increase traffic stress and pollution.
Infrastructure and Policy
| Aspect | Ebikes | Cars |
|---|---|---|
| Infrastructure Needs | Bike lanes, charging stations | Roads, parking lots |
| Parking Space | Minimal | Extensive |
| Incentives | $1,500 tax credit (proposed), $2,000 vouchers | EV credits, less accessible to low-income |
Future Trends
The U.S. ebike market is projected to reach $7.49 billion by 2029. Innovations include:
- Battery Improvements: Lithium-ion prices expected to drop 70% by 2030
- Smart Features: GPS, anti-theft systems, V2X communication
- Subscription Models: Flexible rentals increasing accessibility
Cars will continue to evolve, particularly EVs, but face challenges around energy demand and sustainability.
Ultimately
In 2025, ebikes emerge as a superior choice for sustainable transportation in urban settings. They produce minimal emissions, cost a fraction to own and operate, and promote physical activity—making them ideal for short commutes. Cars, particularly EVs, remain necessary for long-distance travel and heavy cargo but lag in sustainability due to higher emissions and infrastructure demands. With growing markets, technological advancements, and supportive policies, ebikes are set to redefine urban mobility, complementing cars in a balanced, sustainable transportation ecosystem.
Explore Our eBikes
Discover the electric bikes that make sustainable transportation possible

YorkE 26" Electric Bike – Updated Version

ACTBEST Race Electric Bike for Adults

DAMSON Dual Motor 2000W Electric Bike for Adults

Funhang Electric Bike for Adults, 26'' 1000W Peak Ebike

Vivi Electric Bike for Adults 26" Folding Ebike


